Friday, July 22, 2011

GRASS: Day 5

Catching up on yesterday's work - work meeting in the evening two nights in a row does challenge my blog writing skills... -

I am finally seeing some good progress in my understanding of the raster function by starting to find useful tricks... but I also came to the conclusion that I might need to be more selective in my reading because trying to understand every single page might bring me to a similar status and appearance to Mathusalem.

Again I witness today that the Python GUI (still the best thing for me to use as I couldn't get a proper display with the command line) has some command that it doesn't take however there seems to be usually alternative.

A great example of this is with the querying function for raster layers.
Mitasova and Neteler recommend the following command which enables a interactive querying methods with controls... which fails in the python GUI
d.what.rast
The manual option (again manual in my world means to option that you have to click on in the GUI) has been highlighted in circle in the screenshot below ( I had to draw a equivalent to the pointer)...

 but is it also possible to still do it through the command line with the following code (with North Carolina dataset, as usual) with the coordinates of the point.
r.what -f landuse96_28m east_north=638650.220610
(the -f flag includes the category's name)

now some other informative query codes
#numeric terrain profile
r.profile
#univariate statistic can use flag -e to show median and 90th percentile
r.univar
#statistic report, possible to use unit to ask for extra info eg. cell, hectares, percent
r.report landuse96_28m unit=c,h,p

Solution to Day 4's Problem 1

now I hope you are all well seated because... I have found the solution to yesterday problem 1, ouf, how exciting... (sorry with perspective, thinking how chuffed I was yesterday to figure that one, well, it is fairly worrying...)

So as a reminder, hell were breaking loose when  was typing this line of code...
d.rast -o elevation val=100-160
but I could do the overlay manually and in the menu they were even saying how overlay was the flag o...
well due to a mixture of desperation, genius or insanity, since I was facing a similar code problem... (sorry didn't take note of the code itself, but as you will soon see it is irrelevant)
I tried this instead.
d.rast elevation val=100-160 -o
It worked. In vernacular, I moved -o to the end, since I noticed that some code had the flag at the end and when I was doing so the GUI was giving me the o option... (which is why I like this python GUI, we are maintaining a lovely relationship now)

The quest of the missing code

A little problem I encountered today though was a missing code... Not only it didn't work in the GUI, it even wasn't in the list... and when I looked into the GRASS manual, well it was none existant... So if anyone can explain why they make quite a fuss about it in the book (maybe it only works and even show up to a chosen few) please let me know... hehe.
r.digit
(v.digit exists, but not r.digit)

But let's leave these myterious matters behind, to expose the first concrete useful thing for a archaeologist I have finally achieved on GIS...
Can you guess? Yes... That's it.
I have generated a random sampling map... WONDERFUL. (now that is exciting and even useful)
r.random.cells
Here is the masterpiece... Isn't it absolutely gorgeous? And I have even modified the Metadata about it...
Un vrai chef-d'oeuvre...

Thursday, July 21, 2011

GRASS: Day 4

Quick summary of yesterday, similar to day 3, lots of reading, less codes and a lot of headaches...

I've completed Neteler and Mitasova ch.4 about uploading files. I am hoping at this early stage to stick to more common files types e.g. GeoTIFF and Esri Shapefile, but I tried to get a least a grasp of what else could be achieved. A lot of the work seem to be done with external tools Gdal for raster layers and OGR for vector (which is visible in the command r.in.gdal). I've touched these tools before as they are also part of Quantum. They enable among other things to only upload a portion of a large raster to match the selected region etc.

I am now starting on Raster layers...
After a bit of playing around, I started to face difficulties - if you want to crash the software like me, follow the instructions below -
As I have mentionned on Day 3, I'm currently sticking to the python GUI as it is the only one which display information correctly and it has good support when writing code... But. the GUI does not respond to all the codes given in the book (which is based on using command line in a UNIX system).
For example Problem n.1, let's try this (with the North Carolina sample data).
g.region rast=elevation -p # that line is remembered from the top of my #head, it might be not perfect but it works for this example
d.rast elevation # this line is optional, the problem occurs with and #without
d.rast geology_30m
d.rast -o elevation val=100-160

now in theory this should overlay the elevation values between 100-160 on top of the geology layer... but it doesn't. Here is an quick image of what the code of the problem looks like.
and for some reason, it seems to jam after this...


If I remove the overlay command (-o) it works, but I then need to do the overlay manually (by going in layer/properties in the Map layers window).

For some curious reason the same type of problem code come when I try:
d.rast help
which I would have thought is a pretty standard request.

I do not know where I have gone wrong yet, despite a lot of figgeting about. I will have to try again later.

Another difficulty (Problem n.2) came when I was trying to apply a legend, north arrow etc. It seems that the GUI does not accept to use command console to add text to a map for example.

Still I have succeeding in having fun with a few simple raster commands, for e.g.
r.info
r.colors

I have learned how to manipulate and modify the metadata information with
r.info
r.category
r.support (to do modifications)

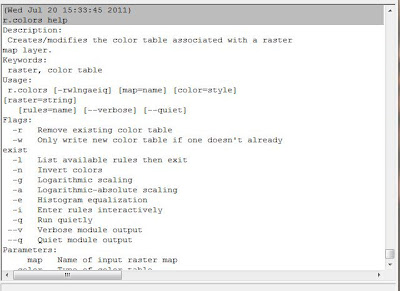
and most importantly, I must admit I am absolutely amazed at the quality of the help files (in comparison of Quantum, at least for the code section) Here is a sample of how clear their help is (which for the poor Neophyte that I am is quite vital).
Isn't this absolutely wonderful?

Tuesday, July 19, 2011

GRASS: Day 3

Here I am back to it... it..., sounds slightly alien... an unknown organism, ready to give you access to its great powers, if you crack its logic and language.

Well with the conclusions and explorations of Day 2, I have decided to work with the python GUI, as it is the only one which display 2D maps (even if I still need a manual touch to make them look as they should). Also, now that I understand why some command like d.mon x0 are not working since they don't apply to the GUI, I can more appreciate the help that the command lind does offer e.g. any failure is detailed and solutions are often offered, I think I can also visualise the code that I do manually (by pressing icons rather than entering command line) - need to triple check that last aspect though, I know it applies when the code fails -.

Mainly what I did wasn't that interesting, I mostly read about the project data management (that Grass does by itself) work with coordinate systems, how to start new projects (not worth describing, the easiest way to learn is to use the GUI and have a look around), projection with the help of Gdal and OGR as well as uploading files.

but MAINLY, I try to solve a few issues I faced on Day 1 with uploading simple files.

Here are the details.
On Day 1, before playing much with the book (IMPORTANT FACT: I am currently using to help my learning of Grass NETELER, M. and H. MITASOVA Open Source GIS A Grass Approach 3rd Edition http://www.amazon.co.uk/Open-Source-GIS-GRASS-Approach/dp/1441942068/ref=sr_1_1?ie=UTF8&qid=1311109845&sr=8-1 ) I had try to upload some simple Ordinance Survey shapefiles and raster (GeoTiff to be exact) that I knew well. And I failed... miserably, which is why I simply started to work with the North Carolina sample data.

But today, with new determination, I tried again. The command line gave me the following mistake "Grass 'ascii' codec can't encode character u'\xe9' in position 37: ordinal not in range(128)" (note the position changing depending on the file). Obviously I couldn't make much sense of what that meant. After a browse online, I started to get it was a notion of character (a frequent problem with my french canadian keyboard) that wasn't accepted properly. I remembered about my mentor (yes because you see, GIS is a bit like Jedi, there are mentors -- I won't go up to say master-- and padawan) about the location of files and folders and how simple name without white spaces are best. So just for the fun of it, I moved the location of the files I was trying to open closer to C:/ and I cleaned the names... Well guess what? It worked.
KEY TIP: keep the files you want to use in a simple folder e.g. C:/mygis and keep the name without accents and spaces.

Now that this problem was solved, were the files working and displaying the lovely Cumbria? No, of course not. It couldn't be that simple.
I started to hit another problem which had plagued me in Qgis, and left me on the verge to give up: projection unknown and no match to the projection of the project/location.
This time the help in the command line offered me a solution (which I later found also mentionned in the book): override the projection check with -o. The best thing to do (even if you tried to upload the file manually) is to go fetch in the command history the piece of code, add -o after the first portion of the code r.in.gdal (for raster files) and the projection of the location/project will be applied to the layer.
Now why does that happen? Following Neteler and Mitasova (the book people) it is a common problem with data in TIFF/TFW format: the tfw file contains the coordinate but no projection information.
So armed with that knowledge, I was able to also apply to override to shapefiles and finally managed to get my Ordinance Survey data uploaded (I tested the process with some data given by my mentor as well).
Ordinance survey data from Cumbria, square NY and A roads

So mainly I read - not worth trying all the codes for subjects mentionned until needed - and solved an annoying problem. It was maybe a small step (and I am not even sure if I could apply anything similar in Qgis) but at least it is progress.

And as Joseph Joubert said "The aim of an argument or discussion should not be victory, but progress."

Wednesday, July 13, 2011

GRASS: Day 2

Where is Day 1 gone? Well I did say I am a rubbish blogger, moreover I had no journal yesterday...

Some basics, but then the boring bits starts.
more information on Grass can be found here... http://grass.osgeo.org/ It is less user friendly than Quantum, but it is a lot more powerful and certainly more stable, as it has been around for many years (if I read well it originates from military uses, how strange is it that a lot of the world greatest inventions where born out of war, what image does it give of human kind?)
I downloaded it from OSGeo4W, from which you can get many open source software in one installer, I've been told that is better to do it that way, as it gives also a command line post to start all these programs (and maybe they can interact better with each other, who knows...). Bref, (yes another french word worth knowing, it sounds better than "anyway" and is smaller than "to summarise") here is a link. http://trac.osgeo.org/osgeo4w/

Now to avoid anyone as silly as me to figure out how to get grass to work from the command line interface, here you go, rince your eye (and look in Usage): http://trac.osgeo.org/osgeo4w/wiki/pkg-grass

Boring bits starting... now.

After a lots of mixed results and fumbling yesterday here is my conclusions for day 2.

I understand fairly well how the Grass command system work now after a couple of days of playing with it,  I am very impress that there is help and index for all the commands (something that I did not find for Quantum and the python language and made my life close to a living hell)
here is the code:
g.manual -i (then you go in Display commands manual, then at the bottom of the page in full index)

Here are the main pieces pieces of code I've played with (to use with the North Carolina Sample data)
#list maps
g.list rast
g.list vect

#normal 2d display
g.region rast=elevation -p
d.erase #does not work in the GUI, I wonder if it mainly apply for UNIX
d.rast elevation
d.his h=elevation i=elevation_shade
d.vect streams col=blue
d.vect roadsmajor
d.vect overpasses icon=extra/bridge size=15 fcol=blue

#and the most impressive results with the 3D
nviz elevation vect=streams,roadsmajor point=overpasses

#and that is it, it sounds small but I had quite a headache to just get all of that to work the way I wanted

I have played a bit with the command line from the python interface of Grass, it is good as it gives you choices when you are typing, however, if I manage to display a map, the layers options that I had decided, e.g color blue, etc, do not show up until I manually go check the options in their propriety (right click or double click) in the display of map layers.

When I finally got how to use the OSGeo 4W command line interface (see above and yes I do feel relatively stupid) I tried to display map, but it comes as a png of a single layer at the time on my desktop, tried to open a monitor with
d.mon x0
but that is just for Unix or Mac, otherwise they recommend to download a X-server (not quite sure which one to get) or to use another GUI (I really hate this name, it sounds slimy) with:
gis.m
But the blooming GUI does seem to want to display my map...

Still all is not lost, I had a bit of a play around with the nviz module for 3D (for now it is more 2.5D but nevermind) and at least I seem to be able to get results there...

Here is a Screenshot.
nviz displaying North Carolina sample data

Confessions of a failed blogger

Yes... I admit it...

I am rubbish, utterly rubbish at keeping a blog.

A very good thing that I am not trying to become a writer...

My poor computer is filled with a few nearly finished pieces about GIS, which seem doomed to a life in limbo without ever reaching the CLOUD... they were obstructing too much my mind and distracting me from the chaotic path to the GIS Open source enlightenment... & let me say firm and loudly how chaotic this path is... in April and May I got battered and bruised, between unfinished help index, and limited tutorials, I thought many times to die and give up... yet a few months later, I am still here...

And what I need... Is a journal!!?
A journal so my kind-hearted mentor can follow what I'm trying to do - or failing often -. A journal so I, and you, if anyone tries to read it, can keep track of the happy days when it works, and the less happy and more common ones, when all fails... But beware, it is another attempt at writing, no promises that I will be better this time at completing it... and moreover, it will be dry, dry and boring. (although to warn you it will always start by the title of the project I am working on, then the day)  What will it be about? At the moment two distinct efforts... The first is to learn how to use GRASS, one of the most powerful open-source GIS software out there and especially its 3D functions http://grass.osgeo.org/. The second, the completion of the FG project (pronouce 'figi'), an interactive map of the Forest Gardens in Cumbria. I warned you but let me say it again, this is more to keep track than to attract litterate discussion, I'll try to add links and maybe if I'm inspired a couple of line of descriptions, but don't get your hopes up, don't hope for much.

Still amateurs of my witty interpretations of the keys to the GIS world, fear not... I do intend to take again my cybernatic pen and finish and write more of these litterary pieces more worthy of your attention than my journal ramblings, I still want to try to support other pure and innocent souls which embarks on this dangerous, this erratic and barmy idea - but Oh so worth doing - of learning GIS on your own...